 Pie Chart is very useful when you’re developing any business
app to show the records and data. AChartEngine is very useful and effective library to create
the chart and dynamic status of project. Its very easy to use and implement.
Pie Chart is very useful when you’re developing any business
app to show the records and data. AChartEngine is very useful and effective library to create
the chart and dynamic status of project. Its very easy to use and implement.
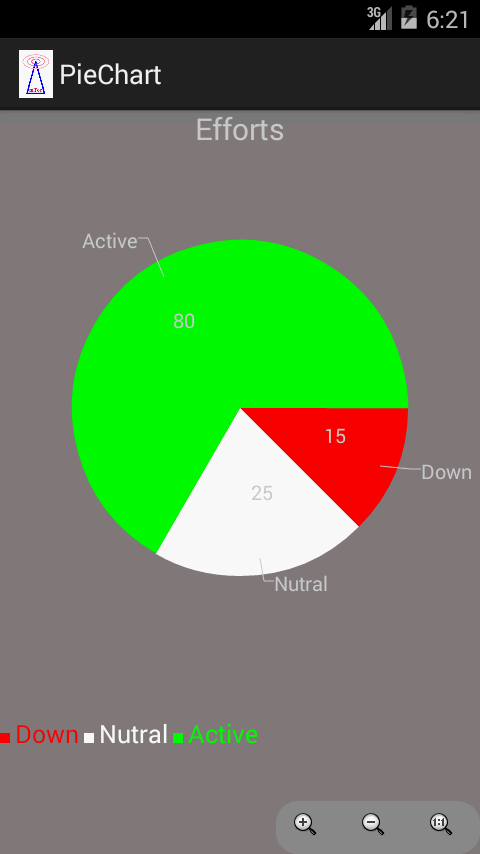
In below example main activity is Dashboard. When user
clicks on ViewStatus button ,it leads to next graphical activity where pie
chart is visible. Here i’m showing the
static data in chart. But you can fetch data from the server and save it in
variables and in place of static data you can keep that variables to achieve
dynamic chart.
Steps to create PieChart in Android:
Step 1- Create a new project , and give activity name as
dashboard.xml
Step 2- Include the
achartengine.jar file in your project. Check the below link for step by
step process: http://www.allandroidcodes.com/2014/04/how-to-use-achartengine-in-android-how.html
Step 3- Add following
tag in you AndroidManifest.xml file
<activity android:name="org.achartengine.GraphicalActivity"/>
Step 4- Design your first activity with one button as following:
dashboard.xml
<?xml version="1.0"
encoding="utf-8"?>
<RelativeLayout xmlns:android="http://schemas.android.com/apk/res/android"
android:layout_width="match_parent"
android:layout_height="match_parent"
android:background="@drawable/gradient" >
<TextView
android:id="@+id/textView1"
android:layout_width="wrap_content"
android:layout_height="wrap_content"
android:layout_alignParentTop="true"
android:layout_centerHorizontal="true"
android:layout_marginTop="17dp"
android:text="Dashboard"
android:textAppearance="?android:attr/textAppearanceLarge" />
<Button
android:id="@+id/button1"
android:layout_width="wrap_content"
android:layout_height="wrap_content"
android:layout_below="@+id/textView1"
android:layout_centerHorizontal="true"
android:layout_marginTop="42dp"
android:text="View Status" />
</RelativeLayout>
For background color i used gradient. Create one
gradient.xml file inside drawable folder
gradient.xml
<?xml version="1.0"
encoding="utf-8"?>
<shape xmlns:android="http://schemas.android.com/apk/res/android"
android:shape="rectangle">
<gradient
android:startColor="#2B65EC"
android:endColor="#00FFFF"
android:angle="90"/>
</shape>
You can change the color according to your wish. You can
also add this background in any activity or view using android:background="@drawable/gradient"
After this your screen will look like
this.

Step 5- Create a new class as
EffortChart.java.Here we will implement the functions of AChartEngine to show
PieChart. All logics related to chart should be in this file.
EffortChart.java
import
org.achartengine.ChartFactory;
import
org.achartengine.model.CategorySeries;
import
org.achartengine.renderer.DefaultRenderer;
import
org.achartengine.renderer.SimpleSeriesRenderer;
import android.R.color;
import android.content.Context;
import
android.content.Intent;
import
android.graphics.Color;
/*This is a class for PieChart, its
not an activity class
*/
public class EffortChart {
public Intent
getIntent(Context context){
/*
* Here in Performance array instead of static
values you can
* pass variable for dynamic chart
*/
int[]
Performance={15,25,80}; // [0] for Call, [1] for Meeting, [2] for Email
CategorySeries
series=new CategorySeries("pie");// adding series to
charts. //collect 3 value in array. therefore add three series.
series.add("Down",Performance[0]);
series.add("Nutral",Performance[1]);
series.add("Active",Performance[2]);
//
add three colors for three series respectively
int[] colors=new int[]{Color.RED,Color.WHITE,Color.GREEN};
//
set style for series
DefaultRenderer renderer=new DefaultRenderer();
for(int color:colors){
SimpleSeriesRenderer r=new SimpleSeriesRenderer();
r.setColor(color);
r.setDisplayBoundingPoints(true);
r.setDisplayChartValuesDistance(5);
r.setDisplayChartValues(true);
r.setChartValuesTextSize(15);
renderer.addSeriesRenderer(r);
}
renderer.isInScroll();
renderer.setZoomButtonsVisible(true); //set zoom button in Graph
renderer.setApplyBackgroundColor(true);
renderer.setBackgroundColor(R.drawable.gradient); //set background
color
renderer.setChartTitle("Efforts");
renderer.setChartTitleTextSize((float) 30);
renderer.setShowLabels(true);
renderer.setLabelsTextSize(20);
renderer.setLegendTextSize(25);
renderer.setDisplayValues(true);
return ChartFactory.getPieChartIntent(context,
series, renderer, "PieChart");
}
}
Step 6- Go to Dashboard.java file and
under buttonOnClickLitener Create the intent to start the graphical activity to
show the PieChart.
Dashboard.java
import
android.app.Activity;
import
android.content.Intent;
import android.os.Bundle;
import android.view.View;
import
android.view.View.OnClickListener;
import
android.widget.Button;
public class Dashboard extends Activity {
Button
b;
/** Called when the
activity is first created. */
@Override
public void onCreate(Bundle
savedInstanceState) {
super.onCreate(savedInstanceState);
setContentView(R.layout.dashboard);
b=(Button) findViewById(R.id.button1);
b.setOnClickListener(new OnClickListener() {
@Override
public void onClick(View arg0) {
// Creating Intent
for Effort.java
EffortChart
effort=new EffortChart();
Intent
in=effort.getIntent(getApplicationContext());
startActivity(in);
}
});
}
}
Step 7- Save and Run the project.
Application screens will look like this.


Please feel free to comment or write me
for any doubt and suggestions. Your suggestions are appreciable.